Introduction
Human populations across the world are characterized by generally low genetic differences as compared with their intrapopulation variation. These differences can be quantitative, pronounced in different frequencies of the same derived states of ancient polymorphic markers (eg, majority of the HapMap markers1), or qualitative, in which case younger derived variants are found restricted to a particular geographic region or population. The Y-chromosome haplogroup structure frequently shows a good qualitative correlation with continental boundaries, and the geographic specificity of the markers can most often be explained by their phylogenetic descent order rather than by drift alone.2,3 Recently evolved polymorphisms unless amplified by selection or specific founder effects tend to have low frequencies in modern populations, characterized generally by increased effective population sizes in the Holocene period. One of the notable outliers to this rule, because of its high frequency and young age, is the transcontinental spread of haplogroup R1a.4,5 Early observations have led to various interpretations associating R1a phylogeography with certain cultural developments of the past. Even though R1a occurs as the most frequent Y chromosome haplogroup among populations representing a wide variety of language groups, such as Slavic, IndoIranian, Dravidian, Turkic and Finno-Ugric, many authors have been particularly interested in the link between R1a and the Indo-European language family. For example, R1a frequency patterns have been discussed6,7 in the context of the purported link connecting IndoEuropean-speaking pastoralists and the archeological evidence on the distribution of the Kurgan culture in the Pontic steppe.8 A more precise interpretation of the underlying prehistoric and historic episodes of R1a chromosomes across this wide span of Eurasian geography remains largely unknown because of insufficient information on the phylogenetic subdivisions within haplogroup R1a. We address this shortcoming here by analyzing more than 11 000 DNA samples from across Eurasia, including more than 2000 from haplogroup R1a to ascertain the phylogenetic information of the newly discovered R1a-related SNPs. We also examine the STR diversity of the associated R1a subclades to better understand the demographic history and prehistoric cultural associations of one of the most widely spread and frequent Y-chromosome haplogroups in the world with post-Last Glacial Maximum origin.
Materials and Methods
Twelve recently reported R1a markers ascertained in one R1a1 individual2,9 across extensive but unspecified coverage and two new SNPs discovered in two R1a1 individuals during a scan of B44 kb10 were genotyped by denaturing high-performance liquid chromatography (DHPLC) and confirmed by direct sequencing in an initial screening of 18 DNA samples belonging to haplogroup R1a from different geographic regions spanning Scandinavia to India. Twelve of these markers were derived in all individuals carrying the M17 mutation, whereas one of the markers, Page68, exhibited an ancestral allele in all samples and was therefore not evaluated further. In addition, two new SNPs were discovered. One (M434) while surveying another SNP reported in the flanking sequence of DYS43811 by DHPLC in a globally representative collection of DNAs that included individuals from Pakistan, and another (M458) was discovered during the initial survey of the Hinds et al9 rs17250901 homopolymer variant. Markers M434 and M458 were variable in a subset of the 18 R1a screening samples and represent new informative subclades of R1a1. Another SNP (M334) was ascertained previously by DHPLC in one Estonian in a panel of 48 R1a1 samples. Marker M334 was not observed in an additional survey of 100 R1a1 Estonian samples and was not studied further. In the population surveys, the markers were genotyped either by DHPLC, RFLP or TaqMan (Applied Biosystems, Foster City, CA, USA) assays. Within specific haplogroups, median-joining networks were constructed. Specifications for the analyses are detailed in the relevant figure legends. The age of microsatellite variation within haplogroups was evaluated using the methodology described by Zhivotovsky et al12 as modified according to Sengupta et al13 using microsatellite evolutionary effective mutation rate of 6.9Â10À4 per 25 years. Sample sizes and frequencies of the main R1a subclades are reported in Supplementary Tables 1–3. STR haplotype data are given in Supplementary Tables 4, 6 and 7. Supplementary Table 5 reports the primer sequences used in genotyping the informative SNPs.
RESULTS AND DISCUSSION
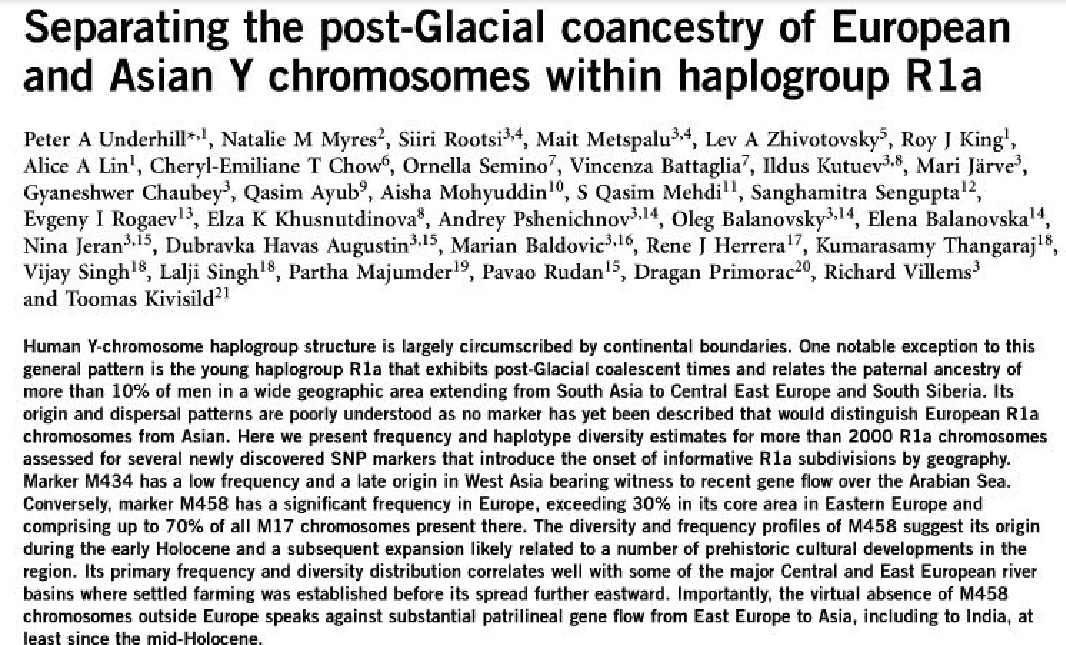
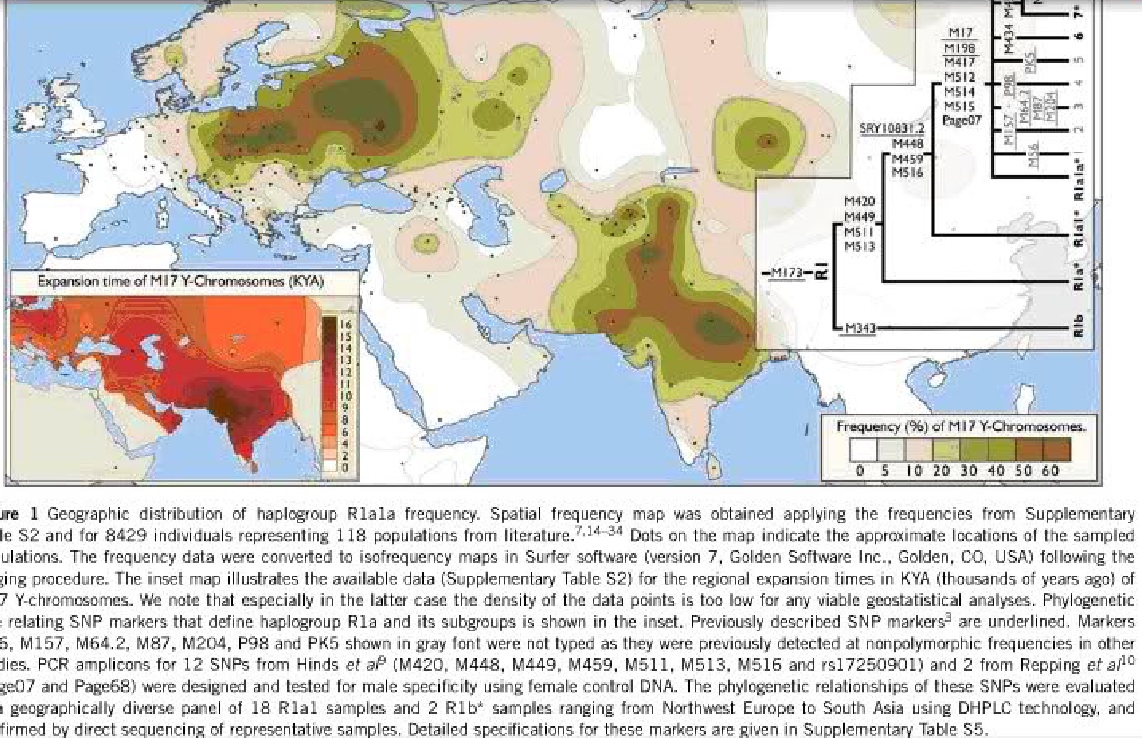
By using the new SNP markers, we were able to fractionate the R1a defining node into a nested series of branches that are reinforced by multiple phylogenetically equivalent mutations (inset, Figure 1). All chromosomes unresolved previously beyond the R1-M173* level14,15,35,36 that were available to us are now attributed to either R1a*-M420 or R1b*-M343 haplogroups. Consequently, we revise the haplogroup nomenclature following the YCC guidelines.3,5 Although the occurrences of the most basal haplogroup R1a*-M420(xSRY10831.2) and the intermediate haplogroup R1a1*-SRY10831.2(xM17) are rare (Supplementary Table S1), the descendent haplogroup R1a1a-M17 assemblage displays informative frequencies above a few percent in populations comprising a broad expanse of Eurasian geography ranging from Norway and Northeast Asia to south India, whereas frequencies above 10% occur in East Europe, West, South and central Asia (Supplementary Table S2, Figure 1). With the exception of a few localized low-frequency subhaplogroups,4,14,37 the majority of haplogroup R1a1a chromosomes have remained so far phylogenetically indistinct.
Recent Arabian Sea gene flow
The marker M434, defining the novel Y-chromosome haplogroup R1a1a6, was observed altogether in 14 individual samples in our screening of 691 R1a1a chromosomes (Supplementary Table S3). Given these data, the haplogroup R1a1a6 distribution seems to be restricted mainly to Pakistan whereas the Omani R1a1a6 samples, all three of which share the same STR haplotype, indicate recent gene flow across the Persian Gulf. The low STR haplotype diversity of R1a1a6 and its absence in 212 Indian R1a1a samples suggest that the M434 mutation may have arisen recently in Pakistan.
In situ diversification
In Central Europe In contrast to the restricted geographic pattern of M434, the R1a1a7 defining marker, M458, was found to be variable in a number of populations, and thus it provides the first significant geographic compartmentalization within the overarching haplogroup R1a distribution. The haplogroup R1a1a7 distribution is confined to Central and Eastern Europe and does not extend eastward beyond the Ural Mountains or southward beyond Turkey (Supplementary Table S2, Figure 2). Its spread in the Caucasus is specific: although absent in the Dagestanian group, it is present at low frequencies both in the northwestern and southern populations, and in particular in Karanogays, who only relatively recently were spread as pastoral nomadic people alongside the Ponto-Caspian steppe belt. The highest frequency of haplogroup R1a1a7 (over 30%) is observed in Central and Southern Poland. Frequencies higher than 10% occur among Western and Eastern Slavic populations whereas elsewhere in Europe, including Southern Slavic groups, the frequency of the derived M458G allele decreases rapidly away from its frequency peak that coincides broadly with the overall R1a1a frequency maximum in Poland (Figures 1 and 2). The R1a1a*(xM458) chromosomes on the other hand are less frequent in Poland and display frequency maximums in Belarus and southwest Russia (Supplementary Table S2). Analysis of associated STR diversity profiles revealed that among the R1a1a*(xM458) chromosomes the highest diversity is observed among populations of the Indus Valley yielding coalescent times above 14 KYA (thousands of years ago), whereas the R1a1a* diversity declines toward Europe where its maximum diversity and coalescent times of 11.2 KYA are observed in Poland, Slovakia and Crete. As islands such as Crete have been subject to multiple episodes of colonization from different source regions, it is not inconsistent that R1a1a* Td predates the date of its first colonization by the first farmers approximately 9 KYA.38 Also noteworthy is the drop in R1a1a* diversity away from the Indus Valley toward central Asia (Kyrgyzstan 5.6 KYA) and the Altai region (8.1 KYA) that marks the eastern boundary of significant R1a1a* spread (Figure 1, Supplementary Table S4.). In Europe, Poland also has the highest R1a1a7-M458 diversity, corresponding to approximately an 11 KYA coalescent time (Supplementary Table S4). Other populations in Europe exhibit declining diversity when sampled at increasing distance away from Central Europe (Figure 2). Westward of the Rhine overall R1a1a frequency is low, signaling a genetic boundary with R1b varieties.39 However, the patterns of currently observed Y-chromosome diversity in East/Central Europe are unlikely to be explained solely by population movements of the last century.40
.
.
Although the median STR haplotype of the derived M458G allele differs from the median type of the ancestral M458A chromosomes at 3 of the 10 STR loci considered in our analyses, the STR data alone are not informative for unambiguous inference of whether an individual has the A or G allele (Supplementary Figures S1 and S2) underscoring the extent of STR saturation and the importance of SNP genotyping to assess phylogenetic ancestry even among closely related lineages.
Phylogeography
Haplogroup frequency, haplotype diversity and coalescent times are three parameters that can be considered as informative for making inferences about the origins and polarity of spread of alleles among populations. The most distantly related R1a chromosomes, that is, both R1a* and R1a1* (inset, Figure 1), have been detected at low frequency in Europe, Turkey, United Arab Emirates, Caucasus and Iran14,41 (Supplementary Table S1). The highest STR diversity of R1a1a*(xM458) chromosomes are observed outside Europe, in particular in South Asia (Figure 1, Supplementary Table S4), but given the lack of informative SNP markers the ultimate source area of haplogroup R1a dispersals remains yet to be refined. In Europe a large proportion of the R1a1a variation is represented by its presently identified subclade R1a1a7-M458 that is virtually absent in Asia. Its major frequency and relatively low diversity in Europe can be explained thus by a founder effect that according to our coalescent time estimation falls into the early Holocene period, 7.9±2.6 KYA (Supplementary Table S4). The highest regional date of 10.7±4.1 KYA among Polish R1a1a7 carriers falls into the period of recolonization of this region by Mesolithic (Swiderian and subsequent cultures) settlers.42,43 The time window of 10À5 KYA BP is a culturally complex juncture period between the Mesolithic and early Neolithic in Europe, thus, not allowing us to relate founder effect with any particular culture specifically. Most broadly, the autochthonous European origin of haplogroup R1a1a7, its narrow spatial distribution and the inversely related decreasing expansion times with increased distance from its core frequency and diversity area are suggestive of a notably successful demic expansion starting from a small subset of radiating founder lineages during the early Holocene period. It should be noted, though, that the inevitably large error margins of our coalescent time estimates do not allow us to exclude its association with the establishment of the mainstream Neolithic cultures, including the Linearbandkeramik (LBK), that flourished ca. 7.5À6.5 KYA BP in the Middle Danube (Hungary) and was spread further along the Rhine, Elbe, Oder, Vistula river valleys and beyond the Carpathian Basin.44
Migratory and early agricultural zones
River valleys are migratory corridors for organisms including humans and such riparian habitats provide opportunities for the forager lifestyle, settled agriculture and establishment of trade networks. The Neolithic communities in Central Europe were primarily located on the margins of river valleys with fertile soils at elevations less than 500 m.45 Haplogroup R1a1a7-M458 diversity and frequency are highest in river basins known to be associated with several early and late Neolithic cultures (Figure 2, Supplementary Figure S3). Assuming the founder effect we detect originated in the sparse Mesolithic population of Central-North Europe, the genetic evidence suggests strong cultural interaction and admixture occurred between the pioneer horticultural groups and local foragers, which resulted in widespread adaptation of the Neolithic lifestyle by indigenous residents. This interpretation is consistent with computational models indicating that although the process of the expansion of farming communities throughout much of Europe would have been demic, even minute amounts of gene flow from foragers over a long time period would have lead to a predominantly Mesolithic contribution to their admixed offspring.46 Following this model, it would not be surprising to associate a localized Neolithic demic expansion with a genetic lineage absent in the Fertile Crescent where farming originated and where other Y-chromosome haplogroups, such as G and J, have been associated with the initial demic spread of farming toward Southeast Europe.38 However, it should be noted that ancient mtDNA evidence from the Central European Mesolithic and LBK sites shows a lack of substantial continuity between Mesolithic, Neolithic and presently living populations of the area.47,48 Notably, mtDNA haplogroups R1a, U4, U5, HV3 and HV4, which have been inferred to have pre-Neolithic spread in East Europe, occur at marginally low frequencies in India.49 It is noteworthy that the LCT-13910T allele associated with lactase persistence and agricultural pastoralism overlaps broadly with the spatial distribution50 of the derived M458G allele. Direct ancient DNA evidence suggests that the lactase persistence allele would have reached high frequency in this area, likely due to strong positive selection, only after the LBK period.51 However, computer simulations have shown that its increased frequency particularly in North Europe does not necessarily imply stronger effect of positive selection there than in other parts of Europe.52 Ancient DNA evidence for the Y-chromosome M458G allele is still lacking and it is therefore possible only to speculate about its existence and prevalence in Neolithic Europe. Beyond its spread in the Central European river basins (Figure 2), the LBK extended around the northern Carpathians into the steppe zone of Ukraine and participated in the establishment of the Cris¸ culture.53 Our data showing high frequency of R1a1a north of the Carpathians and its lower frequency to the South, in the Tisza river valley, are consistent with the genetic boundary previously reported for this region.16